The SWForum.eu Project radar visualises information about projects in two different ways. In its two main views - overall landscape radar, and segmental view - each project is visualised as a "blip" - a circle with a number in it, and a coloured outline.
Hovering over a blip, a tooltip pops up indicating a number and the project acronym; for example, "116. SCOTT". While the project acronym is self-explanatory, the number deserves a bit more explanation.
The modal window is limited in its size; if the content renders longer than the maximum height of the window, scrollbars are added to let you see all contents.
Click the small cross in the upper right corner, or press the ESC key to close the modal dialogue.
The id was originally and historically used to uniquely identify projects across severalspreadsheets, as well as use it as an easy to read visual identifier. The easy to read visual identifier has remained as a convenient way to numerically identify projects for the time being.
The following illustrates how the same project may be illustrated in the main landscape view as well as the segmental view:
The different colour gradients are explained here.
When clicking on a project "blip", the application will provide you with some key information about the project. We will use again project "SCOTT" as an axample:
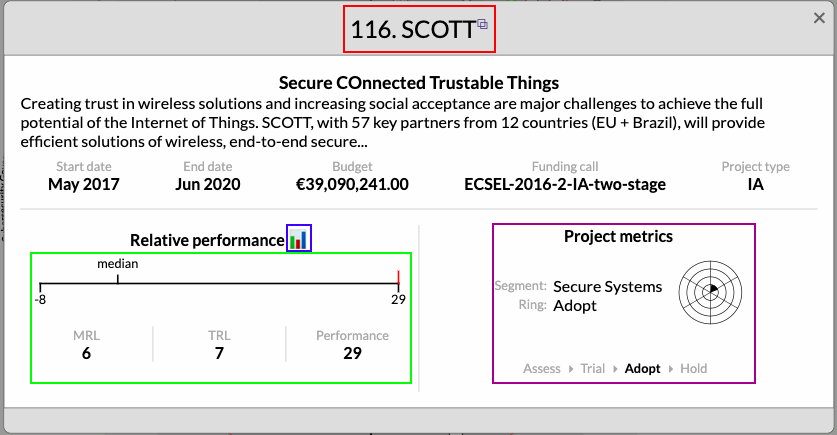
The project information card provides you with technical information about the project, pulled from the EC's CORDIS information system. The heart, however, of the project information window lies in the highlighted areas. The follow sections describe these in more detail.
Shows the project's SWForum.eu unique radar id, and the project acronym. A little symbol to theright of the name indicates that the project is also represented in the SWForum.eu Project Hub. Clicking on the project acronym will open a new tab or window guiding you there.
Project metrics give you a quick overview of the project's location in the radar, i.e. the segment and ring. The ring is also put into linear context of the project lifecycle.
With many projects regularly submitting MTRL scores, we can calculate what we call relative performance: We put a proejct's performance into context with other projects. For each project within the same context we calculate a weighed score, the median, minimum and maximum score, and visualise the current project's performance relative to all projects within the same context.
This sounds rather complex, which is why we'll explain this in more detail here.
The more MTRL scores projects are submitting, the better we can trace their maturing process and velocity. For all projects that submitted two or more MTRL scores, the radar visualises their MTRL score progress in their MTRL score card (see below).
Click on the little graph icon to access the project's MTRL score card.
With two or more MTRL scores, we can start plotting the project's maturing progress.
The following screenshot shows the MTRL score progress for the SCOTT project:
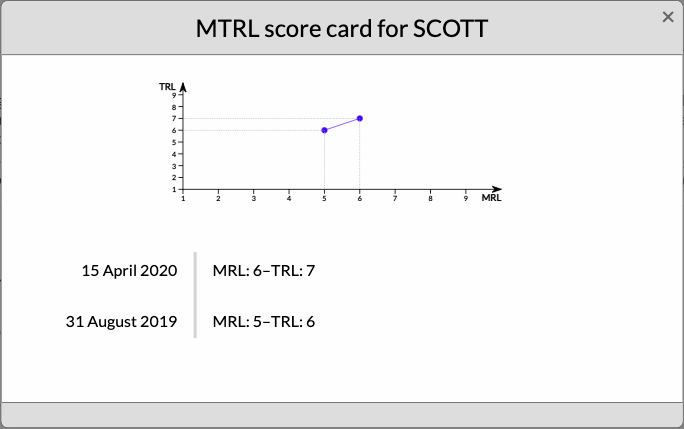
The upper part of the dialogue is filled with a graphical representation of the MTRL score
history of the project. The lower part of the dialogue enumerates all MTRL scores submitted by the project, in descending order (newest first). For each submission, the radar shows:
- Date of submission (f.i. 15 April 2020);
- MRL and TRL scores (f.i. 6 and 7, respectively); and
- Brief rationale provided which outputs and results warrant the submitted result.
Projects may submit as many MTRL scores as they wish. Whenever a new Project Radar is generated, it will pick the suitable MTRL score for any given project. This gives projects the freedom to self-evaluate and submit scores at their own pace and suitable time.